| A perfect amplifier
with an amplification of times 10, as shown above, would give an output
10 times greater than the input, NO MATTER WHAT THE INPUT FREQUENCY.
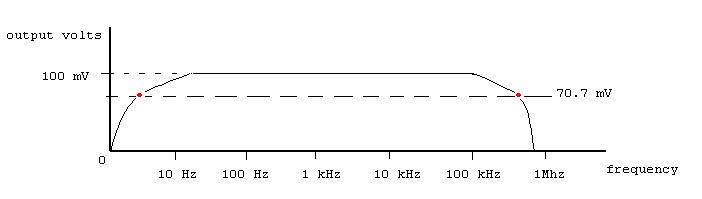
If the input was 10 mV then the output would be 100 mV, no matter the frequency of the input signal, as seen in the graph below. This graph is known as a FREQUENCY RESPONSE diagram.
In a practical
amplifier it is not possible to obtain a perfectly flat response curve.
The two points
in red on the response curve mark where the output of the amplifier has
fallen to 70.7 % of the maximum output.
In some cases
the bandwidth is tailored to pass some frequencies and not others.
|

Copyright Graham Knott 1999